- ai
- blockchain infrastructure
Automated Query Pricing in The Graph
 Alexis Asseman •
 Indexers1 in The Graph have control over the pricing of the GraphQL queries they serve based on their shape. For this task, The Graph created a domain-specific language called Agora2,3 that maps query shapes to prices in GRT. However, manually populating and updating Agora models for each subgraph is a tedious task, and as a consequence, most indexers default to a static, flat pricing model.
To help indexers with pricing in the relative resource cost of serving different query shapes, as well as following the query market price, we are developing AutoAgora, an automation tool that automatically creates and updates Agora models.
See our related Devcon 2022 talk here: https://www.youtube.com/watch?v=LRl9uFfmjEs.
Query relative cost discovery
This work is based on a few trends that we have observed through analyzing the query traffic.
Observations on received queries
One of the major problems of GraphQL is its ability to create very computationally expensive queries. In the worst cases, it is even possible to create exponentially hard queries while the query body itself grows only linearly4. We can indeed observe this on queries against the Uniswap V2 subgraph, where query execution times span 4 orders of magnitude.
Simultaneously, we observed that a vast majority of the queries are based on a small number of query shapes. This is to be expected as most queries are generated programmatically from web frontends, such as the official Uniswap v2 statistics website.
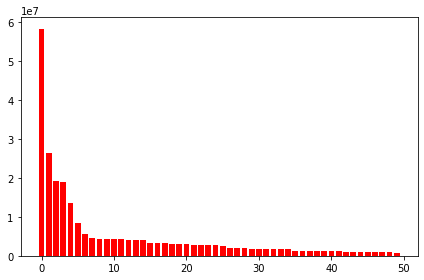
Based on the observations above, a reasonable solution for relative query pricing that would cover most of the value being served by an indexer is to estimate the relative cost of the most frequent queries for each subgraph.
AutoAgora logging and relative costing infrastructure
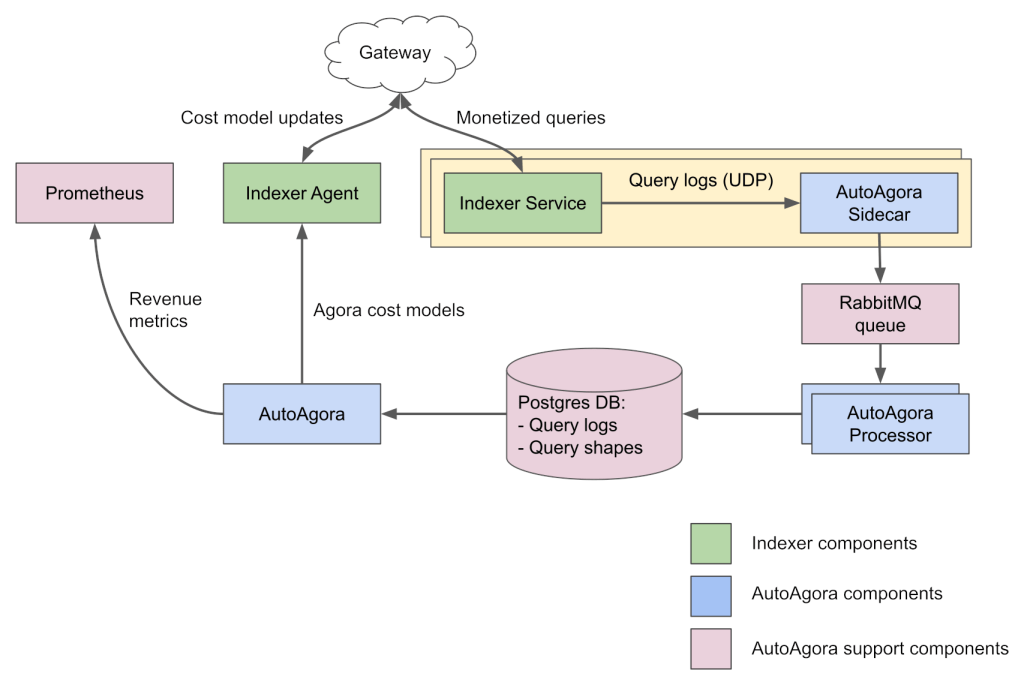
In this section, we will discuss the implementation of the automated relative query pricing discovery feature of AutoAgora, and how it fits in the indexer’s stack.
All monetized queries coming from the Gateway pass through the indexer-service. We modified it to output detailed query logs (subgraph hash, query, variables, GRT fees paid, execution time). These logs are then processed to normalize the queries, separate all query values from the query shapes. Shapes are deduplicated and stored in a PostgreSQL table, while the rest of the log information is appended to a logs table and references its query shape through its blake2 hash.
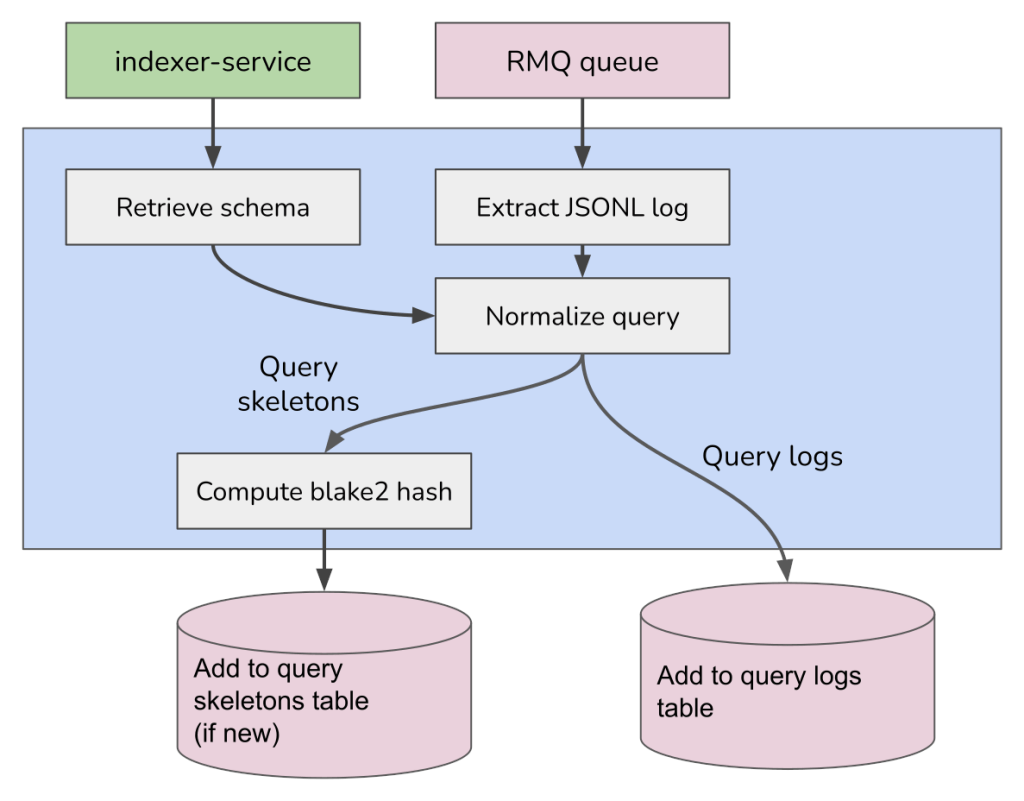
Here’s a sample from the query logs table:
autoagora=# select * from query_logs order by random() limit 3;
-[ RECORD 1 ]---+-----------------------------------------------------
id              | 723883ae-edbb-4ed5-81ad-f06dcc9195e7
subgraph        | QmXDs3UikxJBLwPztj3tLhyFuaV51tEftjSY1AHjBUz3CH
query_hash      | \x8e6c32fce280c7bb43081b0e0173b0b1
timestamp       | 2022-06-17 07:04:00.581+00
query_time_ms   | 56
query_variables | ["0x8289baf639318d9076616d7d231cbfc4f8fdc9bf628b1d43.
                |.e5ebb8e4b125a68d", 100, "preparedTimestamp", "desc",.
                |. 0, "0x7aa9530f8df705d07a048d8508236e9cdf2a8f1331578.
                |.129c918246766962ae1"]
-[ RECORD 2 ]---+-----------------------------------------------------
id              | 50546eda-51e5-43ed-8829-a66a9642355b
subgraph        | QmXDs3UikxJBLwPztj3tLhyFuaV51tEftjSY1AHjBUz3CH
query_hash      | \x35d9bb4ecfd091d6aa75659f9a33a06b
timestamp       | 2022-06-17 03:32:35.185+00
query_time_ms   | 31
query_variables | ["0x8f80d695bb4f3ac71f7392f930f5f91529a54df1ffc40c06.
                |.deb06492af7260d6", "amount", "desc"]
-[ RECORD 3 ]---+-----------------------------------------------------
id              | 4505c23a-bbab-49a0-a58c-49428d51380d
subgraph        | QmXDs3UikxJBLwPztj3tLhyFuaV51tEftjSY1AHjBUz3CH
query_hash      | \x7efa66f59bd19e1c501b091b931a6069
timestamp       | 2022-06-17 03:24:37.586+00
query_time_ms   | 14
query_variables | ["0x723bfdcd48cf2bdb056a2d23003e7d089596056cea9f1799.
                |.68f503661d349fb9", "preparedBlockNumber", "desc", "1.
                |.", "Prepared", "0xcada61e60e8c797c61f0a34468224e782f.
                |.8dfb8d"]
And the corresponding query shapes (also called skeletons in AutoAgora):
autoagora=# select * from query_skeletons where hash in ('\x8e6c32fce280c7bb43081b0e0173b0b1', '\x35d9bb4ecfd091d6aa75659f9a33a06b', '\x7efa66f59bd19e1c501b091b931a6069');
-[ RECORD 1 ]---------------------------------------------------------
hash  | \x7efa66f59bd19e1c501b091b931a6069
query | query($_0:Bytes$_1:Transaction_orderBy$_2:OrderDirection$_3:Bi.
      |.gInt$_4:TransactionStatus$_5:String){transactions(block:{hash:.
      |.$_0}orderBy:$_1 orderDirection:$_2 where:{sendingChainId:$_3 s.
      |.tatus:$_4 user:$_5}){amount bidSignature callDataHash callTo c.
      |.ancelCaller cancelTransactionHash chainId encodedBid encrypted.
      |.CallData expiry fulfillCaller fulfillTransactionHash id initia.
      |.tor prepareCaller prepareTransactionHash preparedBlockNumber p.
      |.reparedTimestamp receivingAddress receivingAssetId receivingCh.
      |.ainId receivingChainTxManagerAddress router{id}sendingAssetId .
      |.sendingChainFallback sendingChainId status transactionId user{.
      |.id}}}
-[ RECORD 2 ]---------------------------------------------------------
hash  | \x35d9bb4ecfd091d6aa75659f9a33a06b
query | query($_0:Bytes$_1:AssetBalance_orderBy$_2:OrderDirection){ass.
      |.etBalances(block:{hash:$_0}orderBy:$_1 orderDirection:$_2){amo.
      |.unt assetId id router{id}}}
-[ RECORD 3 ]---------------------------------------------------------
hash  | \x8e6c32fce280c7bb43081b0e0173b0b1
query | query($_0:Bytes$_1:Int$_2:Transaction_orderBy$_3:OrderDirectio.
      |.n$_4:Int$_5:Bytes){transactions(block:{hash:$_0}first:$_1 orde.
      |.rBy:$_2 orderDirection:$_3 skip:$_4 where:{transactionId:$_5}).
      |.{amount bidSignature callData callDataHash callTo cancelCaller.
      |. cancelMeta cancelTimestamp cancelTransactionHash chainId enco.
      |.dedBid encryptedCallData expiry externalCallIsContract externa.
      |.lCallReturnData externalCallSuccess fulfillCaller fulfillMeta .
      |.fulfillTimestamp fulfillTransactionHash id initiator prepareCa.
      |.ller prepareMeta prepareTransactionHash preparedBlockNumber pr.
      |.eparedTimestamp receivingAddress receivingAssetId receivingCha.
      |.inId receivingChainTxManagerAddress relayerFee router{id}sendi.
      |.ngAssetId sendingChainFallback sendingChainId signature status.
      |. transactionId user{id}}}
Relative pricing is generated periodically from the logs database. For each subgraph, query shapes that have seen more than a threshold number of queries are selected to be included in the Agora model. For each shape, the average query execution time is computed and used as the query shape cost factor in the pricing model.
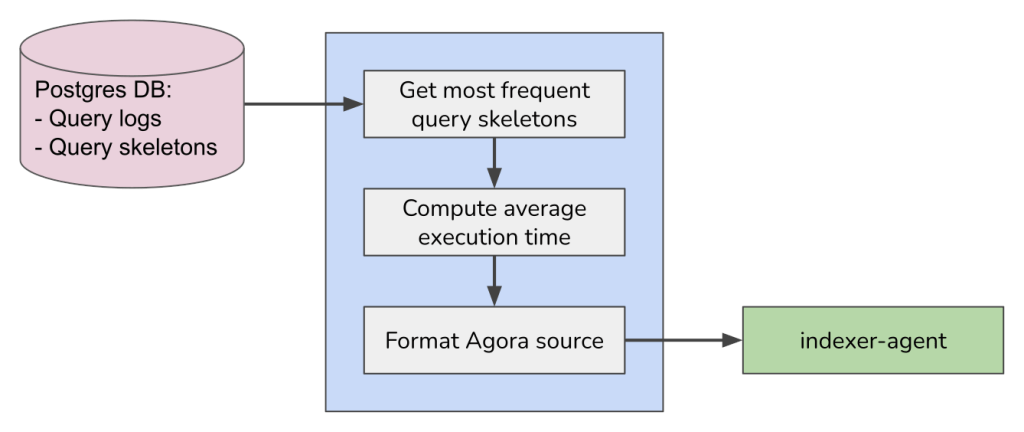
Here is an example of an Agora model generated by AutoAgora for a subgraph:
# count:        1303
# min time:     30
# max time:     12994
# avg time:     4978.261703760552
# stddev time:  3374.180130690477
query {
  erc721Contract(block: {hash: $_0}, id: $_1) {
    transfers(
      first: $_2,
      orderBy: $_3
      orderDirection: $_4
      where: {id_gt: $_5}
    ) {
      contract {
        id
        name
      }
      from {
        id
      }
      id
      timestamp
      to {
        id
      }
      token {
        id
        identifier
        uri
      }
      transaction {
        id
      }
    }
  }
} => 4978.261703760552 * $GLOBAL_COST_MULTIPLIER;

# count:        830
# min time:     4
# max time:     1227
# avg time:     44.67831325301205
# stddev time:  82.78835711833459
query {
  account(block: {hash: $_0}, id: $_1) {
    tokens: ERC721tokens(
      first: $_2
      orderBy: $_3
      orderDirection: $_4
      where: {contract_in: $_5, identifier_gt: $_6}
    ) {
      id
      identifier
    }
    id
  }
} => 44.67831325301205 * $GLOBAL_COST_MULTIPLIER;

default => $DEFAULT_COST * $GLOBAL_COST_MULTIPLIER;
You may have noticed the $GLOBAL_COST_MULTIPLIER variable. It is there to adjust the pricing of all the query shapes to the market price, which is the subject of the next section.
Query market price discovery
The query market
In The Graph, each subgraph, on each gateway (multiple geographies) defines a query market, on which end-consumers compete to buy queries (currently automated through user-defined budgets and quality preferences), and indexers compete to serve queries based on their Agora-defined prices, and their quality of service.
The indexers’ main objective is to maximize profits. For now we simplified the problem down to revenue maximization, where for each subgraph, the query market is treated as a black box that takes a $GLOBAL_COST_MULTIPLIER input value, and outputs the GRT per second earned.
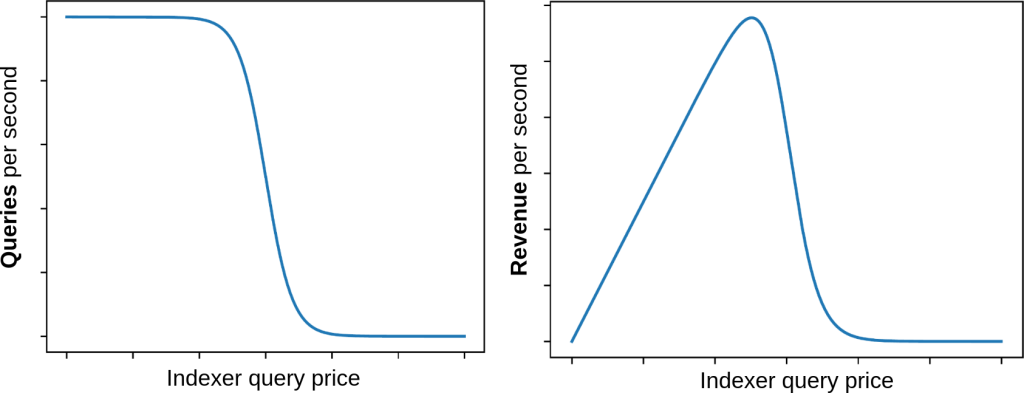
The objective of the AutoAgora price discovery is to find the $GLOBAL_COST_MULTIPLIER that optimizes the revenue rate, as well as continuously adjust it to track markets fluctuations.
AutoAgora absolute price discovery
To find and continuously track the optimal price point requires continuously probing the market “black box” at various price points. However, doing so means that a significant amount of time will be spent serving queries at unfavorable price points. The balance between exploration and exploitation is a reinforcement learning problem that has been extensively studied through the multi-armed bandit problem5.
As such, we are mapping the price discovery problem as a continuum-armed bandit problem. The policy is modeled as a Gaussian probability distribution over $GLOBAL_COST_MULTIPLIER values, from which values are continuously sampled. The mean and standard deviation of the Gaussian policy are continuously optimized through gradient descent using the Adam optimizer.
https://www.youtube.com/watch?v=-YHpYyZ3bYI
Overlay of a simulated query rate curve with the Gaussian model.
We tested the AutoAgora price discovery on our own indexer (semiotic-indexer.eth) on mainnet with great success. The plots below are extracted from our own indexer’s Grafana boards, and shows the convergence to, and tracking of the market price over time (“Bandit mean” and “standard deviation”), as well as the resulting increase in revenue rate (“GRT / second per subgraph”) on the UMA subgraph.
Limitations, Conclusions
Our goal with AutoAgora is to help build sustainable, efficient query markets on The Graph, while also lowering the human operation costs.
While we have shown a successful operation on our own indexer, we are still working on tackling current shortcomings of AutoAgora:
-
The relative cost models based only on average query shape execution time are too simplistic. Other hardware impact measurements could be added, so that indexers can express the relative cost of their hardware commodities (CPU, RAM, I/O, Network, etc.).
-
The initial convergence speed of the market price bandit model is quite slow, taking many hours. One of the main limitations currently is the speed at which the gateways are updating the indexer’s cost models.
-
The price bandit training is unstable on subgraphs with low query volumes. The solution being currently implemented is a simple rule deactivating the training, and defaulting to an indexer-supplied default price multiplier. Such a solution is acceptable, since the revenue expected from a low-query subgraph is expected to be negligeable.
-
The price bandit training stability is unproven when multiple of those agents are competing against each other on the same market. Thus we are working on a simulation environment to stress-test this particular scenario.
Therefore, the state of AutoAgora on the date of publication of this piece is highly experimental, and we do not recommend indexers to use the software in production.
The AutoAgora components are open source under the Apache-2 license, and available at: https://gitlab.com/semiotic-ai/the-graph/autoagora
References
- The Graph Foundation. Indexer. The Graph. Published 2022. Accessed June 17, 2022. https://thegraph.com/docs/en/indexing/
- Zachary B. Cost Model Workshop. Youtube. Published May 24, 2021. Accessed June 17, 2022. https://youtu.be/s7zNzgiL4z4
- Agora contributors. graphprotocol/agora. GitHub. Published 2022. Accessed 2022. https://github.com/graphprotocol/agora
- Wittern E, Cha A, Davis JC, Baudart G, Mandel L. An Empirical Study of GraphQL Schemas. Service-Oriented Computing. Published online 2019:3-19. doi:10.1007/978-3-030-33702-5_1
- Slivkins A. Introduction to Multi-Armed Bandits. FNT in Machine Learning. Published online 2019:1-286. doi:10.1561/2200000068
- Kingma DP, Ba J. Adam: A Method for Stochastic Optimization. Published online 2014. doi:10.48550/ARXIV.1412.6980